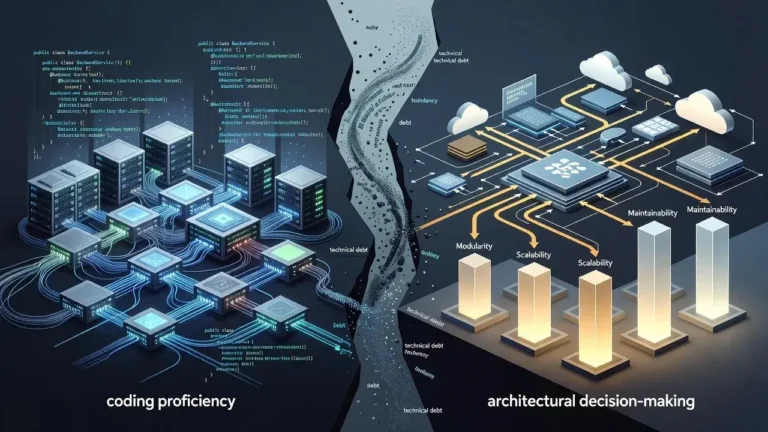
The most common performance killer in JPA applications happens when developers forget to configure fetch strategies properly, causing the infamous N+1 query problem that can execute hundreds of unnecessary database queries instead of just one optimized call.
Junior devs keep making this one mistake with JPA that kills database speed more often than you'd think. Picture this: your application works perfectly during development with a handful of test records, but once it hits production with real data, page load times skyrocket from milliseconds to several seconds. The culprit? Lazy loading configurations that trigger cascading database queries every time your code accesses a related entity.
Understanding the N+1 query problem
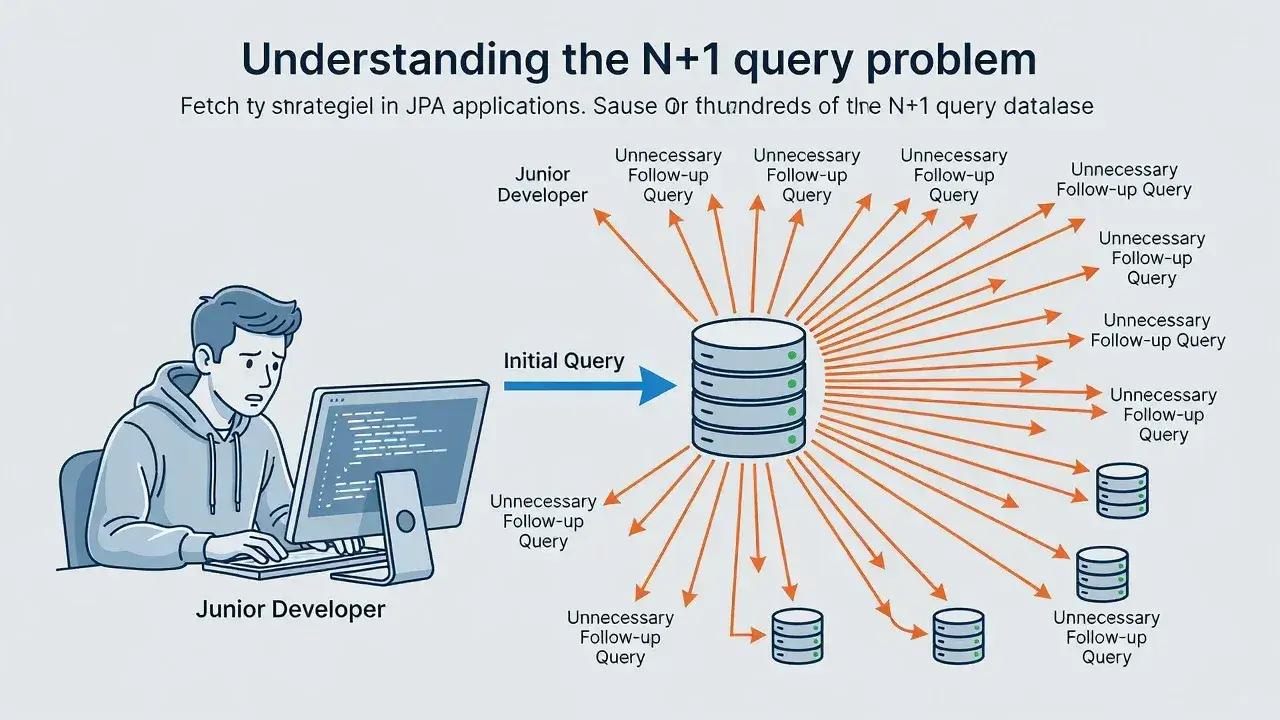
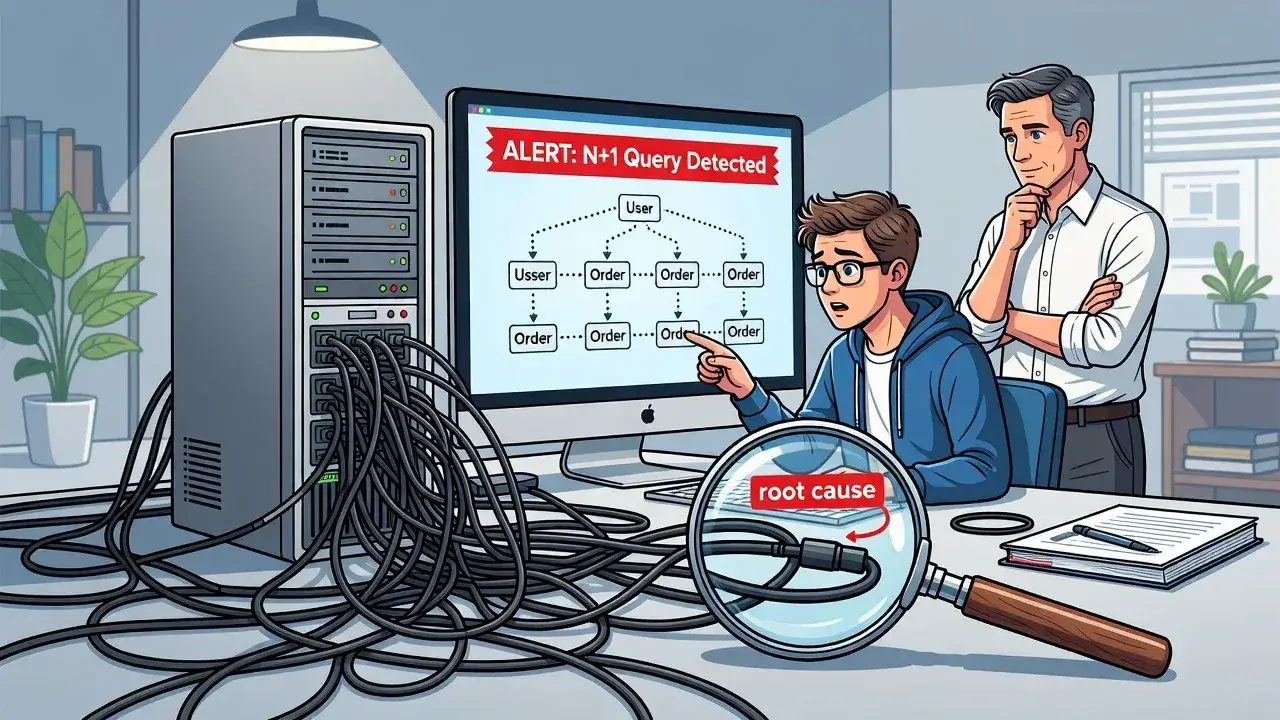
The N+1 problem occurs when your application executes one query to fetch a list of entities, then executes N additional queries to load related data for each entity. This happens because JPA's default fetch type for collections is LAZY, meaning related entities aren't loaded until you explicitly access them.
Imagine fetching 100 users from your database. With lazy loading, JPA executes one query for the users. When your code loops through these users to display their orders, JPA fires 100 additional queries—one for each user's orders. That's 101 queries when you only needed one or two well-crafted JOIN statements.
Why developers miss this during development
Development environments rarely expose this issue because test databases contain minimal data. When you're working with 5 users instead of 5,000, performance problems remain invisible.
Common scenarios that hide the problem
- Small datasets that load quickly regardless of query efficiency
- Local database connections with zero network latency
- Development machines with abundant resources that mask bottlenecks
- Lack of proper performance monitoring tools during testing
Production environments tell a different story. Real user data, network overhead, and concurrent requests amplify every inefficiency. What seemed instantaneous in development becomes painfully slow when scaled.
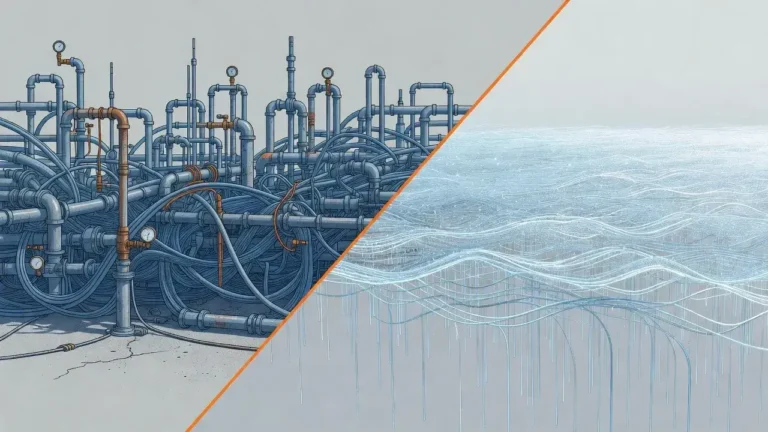
The eager fetching trap
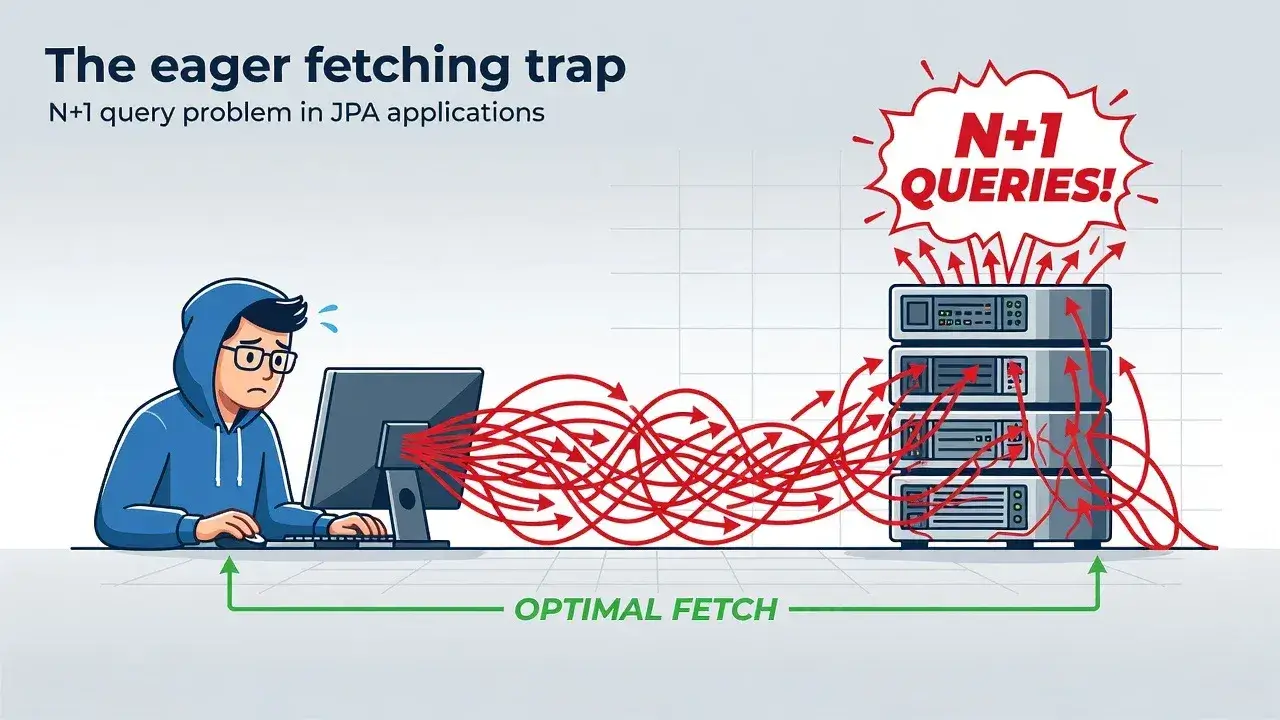
Some developers discover lazy loading issues and immediately switch everything to EAGER fetching. This creates a different problem: loading massive amounts of unnecessary data.
Setting fetch type to EAGER means JPA always loads related entities, even when you don't need them. A simple query for user information suddenly pulls in orders, order items, product details, and everything connected—bloating memory usage and slowing down queries that should be lightning fast.
Finding the right balance
The solution isn't choosing between LAZY and EAGER globally. Smart developers use fetch strategies contextually, loading related data only when specific use cases require it.
Proper solutions that actually work
Several techniques can eliminate N+1 queries without the downsides of eager fetching.
JOIN FETCH queries
JPQL supports JOIN FETCH, which explicitly tells JPA to load related entities in a single query. Instead of letting JPA decide when to load data, you control it precisely where needed.
- Write custom queries using JOIN FETCH for specific endpoints
- Load only the relationships your use case requires
- Keep default fetch types as LAZY for flexibility
Entity graphs
JPA 2.1 introduced entity graphs, allowing you to define loading strategies dynamically without modifying entity annotations. You can create named graphs for different scenarios and apply them at query time.
This approach keeps your entities clean while giving you fine-grained control over what gets loaded. Different API endpoints can use different graphs for the same entity, optimizing each use case independently.
Detecting the problem before production
Prevention beats cure. Configure your development environment to expose performance issues early.
Enable SQL logging in your JPA configuration. Hibernate's show_sql and format_sql properties display every query JPA executes. When you see dozens of similar queries firing in rapid succession, you've found an N+1 problem.
- Use performance monitoring tools like JPA query analyzers
- Set up automated tests that fail when query counts exceed thresholds
- Review database metrics regularly during code reviews
Tools like Hibernate Statistics provide detailed metrics about query execution, cache hits, and entity loading patterns. Integrating these into your CI/CD pipeline catches regressions before they reach production.
Real-world impact on database performance
The performance difference between optimized and unoptimized JPA queries can be staggering. Applications suffering from N+1 problems often see 10-100x slower response times compared to properly optimized versions.
Database connection pools get exhausted quickly when each request spawns dozens of queries. This creates cascading failures where slow queries block new requests, eventually bringing the entire application to a halt during peak traffic.
Memory usage also suffers. Each query creates result sets, JDBC resources, and entity instances that consume heap space. Multiply this by hundreds of unnecessary queries, and you're looking at potential OutOfMemory errors.
Building performance into your development workflow
Avoiding JPA performance pitfalls requires awareness and deliberate practice. The N+1 query problem isn't a framework limitation—it's a configuration and usage issue that developers can prevent with proper knowledge. By understanding fetch strategies, using JOIN FETCH and entity graphs appropriately, and implementing performance monitoring from day one, you'll build applications that scale gracefully. Don't wait for production issues to teach you these lessons; make query optimization part of your standard development process.