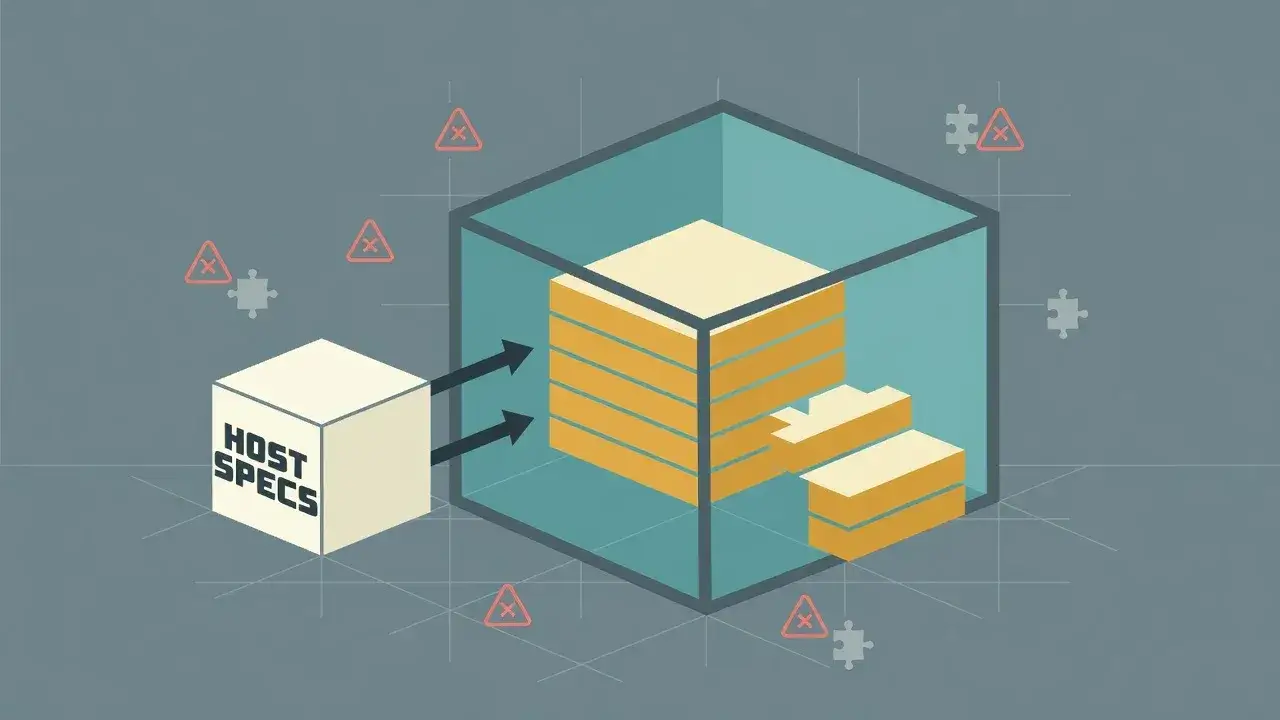
Java containers typically consume three times more memory than necessary due to default JVM settings that ignore container resource limits, causing applications to allocate heap based on host machine specs rather than actual container constraints.
Java container memory bloat remains one of the most overlooked performance issues in containerized environments. Developers frequently deploy applications without realizing their JVM treats a 2GB container as if it has access to the entire 64GB host machine. This misconfiguration leads to unnecessary costs, slower performance, and unpredictable out-of-memory crashes that could easily be prevented with proper tuning.
Why Java containers ignore memory limits
The root cause lies in how the JVM historically detected available system resources. Before Java 10, the runtime would query the operating system for total memory without understanding containerization concepts like cgroups.
When you launch a Java application inside a Docker container with a 1GB limit, older JVM versions see the host's 32GB RAM and configure heap accordingly. The container orchestrator eventually kills the process when it exceeds boundaries, but by then your application has already caused cascading failures.
Legacy detection mechanisms
Traditional JVMs relied on system calls that returned physical hardware specifications. Container technologies like Docker use Linux kernel features to create resource isolation, but these abstractions were invisible to Java runtimes designed before containers became standard.
- JVM reads /proc/meminfo which shows host memory, not container limits
- Default heap calculations use 25% of detected memory as maximum
- No automatic adjustment occurs when cgroup limits are present
- Applications believe they have far more resources than actually available
This fundamental mismatch between container reality and JVM perception creates the 3x memory overhead pattern observed across production environments.
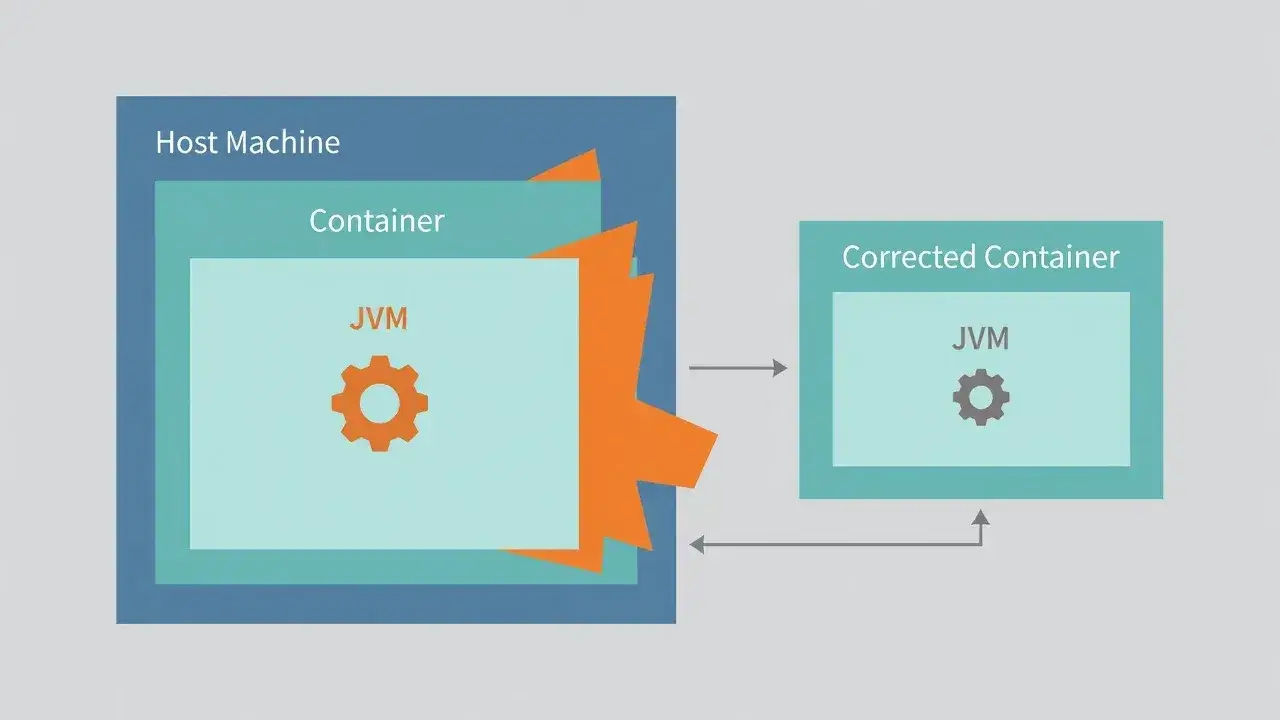
The container-aware JVM solution
Java 10 introduced experimental flags that enable container awareness, which became stable defaults in Java 11. These settings teach the JVM to respect cgroup memory constraints.
The primary flag is UseContainerSupport, enabled by default in modern versions. When active, the JVM reads container-specific resource files instead of host specifications. This single change typically reduces memory consumption by 60-70% immediately.
Implementation steps
- Upgrade to Java 11 or later for automatic container detection
- Verify -XX:+UseContainerSupport is enabled in your startup parameters
- Set explicit heap limits with -XX:MaxRAMPercentage=75.0 for predictable behavior
- Monitor actual memory usage after changes to validate improvements
For applications stuck on Java 8, you must manually specify heap sizes using -Xmx flags based on your container memory allocation. A container with 2GB should use -Xmx1536m to leave room for non-heap memory.
Calculating optimal heap settings
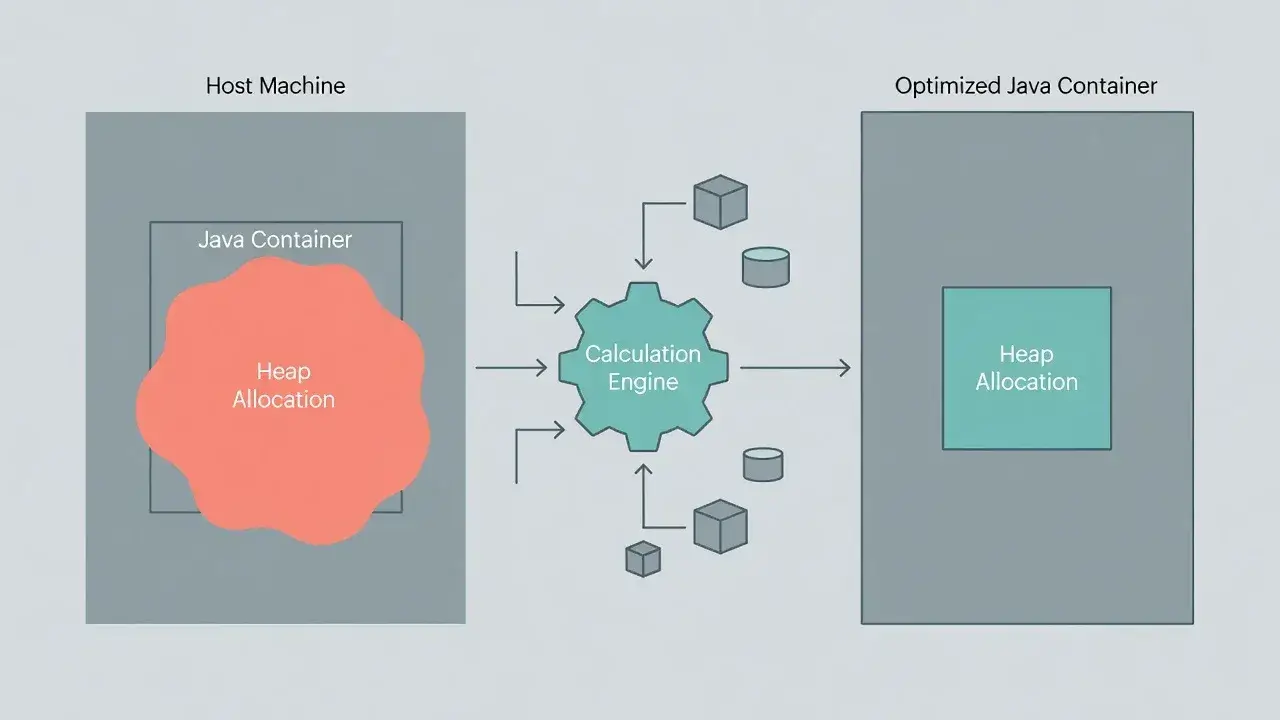
Even with container awareness enabled, default calculations may not suit your workload. The JVM reserves memory for internal operations beyond heap storage.
A good rule allocates 75% of container memory to heap, leaving 25% for metaspace, thread stacks, direct buffers, and native memory. For a 4GB container, set -XX:MaxRAMPercentage=75.0 which yields approximately 3GB heap.
Memory distribution breakdown
Understanding where memory goes helps you tune effectively. The heap stores application objects, but significant memory lives elsewhere in the JVM process.
- Heap: 60-75% of total container allocation
- Metaspace: 128-512MB depending on loaded classes
- Thread stacks: 1MB per thread by default
- Direct buffers: varies by I/O patterns
Applications with many threads or heavy reflection usage need more non-heap space, requiring lower heap percentages to avoid container limits.
Monitoring and validation techniques
After implementing fixes, verify actual memory behavior matches expectations. Container metrics and JVM statistics should align closely.
Use docker stats to observe real-time container memory consumption. Compare this against JVM metrics from tools like JConsole or Prometheus exporters. The container memory should stay safely below limits with minimal unused allocation.
Key metrics to track
- Container RSS memory versus limit percentage
- JVM heap usage and maximum heap size
- Garbage collection frequency and pause times
- Out-of-memory error rates before and after changes
Proper configuration results in stable memory usage patterns with predictable GC behavior and zero OOM kills from the container orchestrator.
Common pitfalls and edge cases
Several scenarios can undermine your optimization efforts. Multi-stage Docker builds sometimes copy JVM configurations incorrectly between stages.
Sidecar containers sharing pod resources in Kubernetes require careful memory budget division. If your application container requests 2GB but a logging sidecar needs 512MB, your JVM should only use 1.5GB maximum.
Base images matter significantly. Some container images include JVM distributions with custom default settings that override your flags. Always verify active JVM parameters using -XX:+PrintFlagsFinal in your startup logs.
Performance impact and cost savings
Fixing Java container memory configuration delivers immediate benefits. Applications run with tighter resource allocation, enabling higher pod density on cluster nodes.
A typical deployment running 50 Java services with 4GB containers each wastes 100GB of memory with default settings. Proper tuning recovers 60GB, allowing 15 additional service instances on the same hardware. Cloud environments translate this directly to reduced infrastructure costs.
Response times often improve as well because appropriately sized heaps trigger more efficient garbage collection patterns. Oversized heaps cause long GC pauses, while right-sized heaps maintain consistent application performance.
Final thoughts on container memory management
The 3x memory overhead in Java containers stems from historical JVM design decisions that predate containerization. Modern Java versions solve this automatically with container-aware settings, but many production environments still run misconfigured applications.
Upgrading to Java 11 or later and validating container support flags eliminates most issues immediately. For legacy applications, manual heap sizing based on container limits achieves similar results. The investment in proper configuration pays dividends through reduced costs, improved reliability, and better resource utilization across your entire container infrastructure.