The debugging trick that cut my Java learning time in half involves using systematic print statements and breakpoints to visualize code execution flow, transforming abstract concepts into concrete, understandable patterns that accelerate comprehension and problem-solving skills.
The debugging trick that cut my Java learning time in half changed everything about how I approached programming. Instead of staring at code for hours wondering why it didn't work, I learned to ask the right questions and see exactly what my program was doing at each step. This simple shift made complex concepts suddenly click.
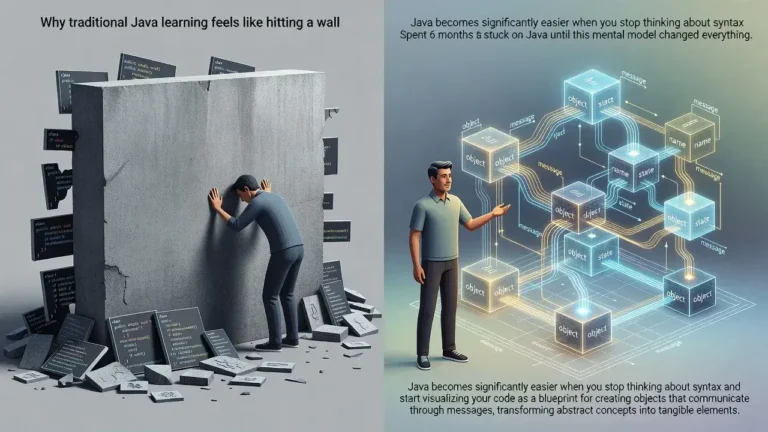
Why traditional learning methods slow you down
Most Java beginners read tutorials and watch videos, then try to write code from memory. This approach creates a gap between theory and practice that's hard to bridge.
When errors appear, new programmers often feel lost. They reread the same documentation without understanding what's actually happening inside their program. The code remains a black box, and learning becomes frustrating guesswork rather than systematic discovery.
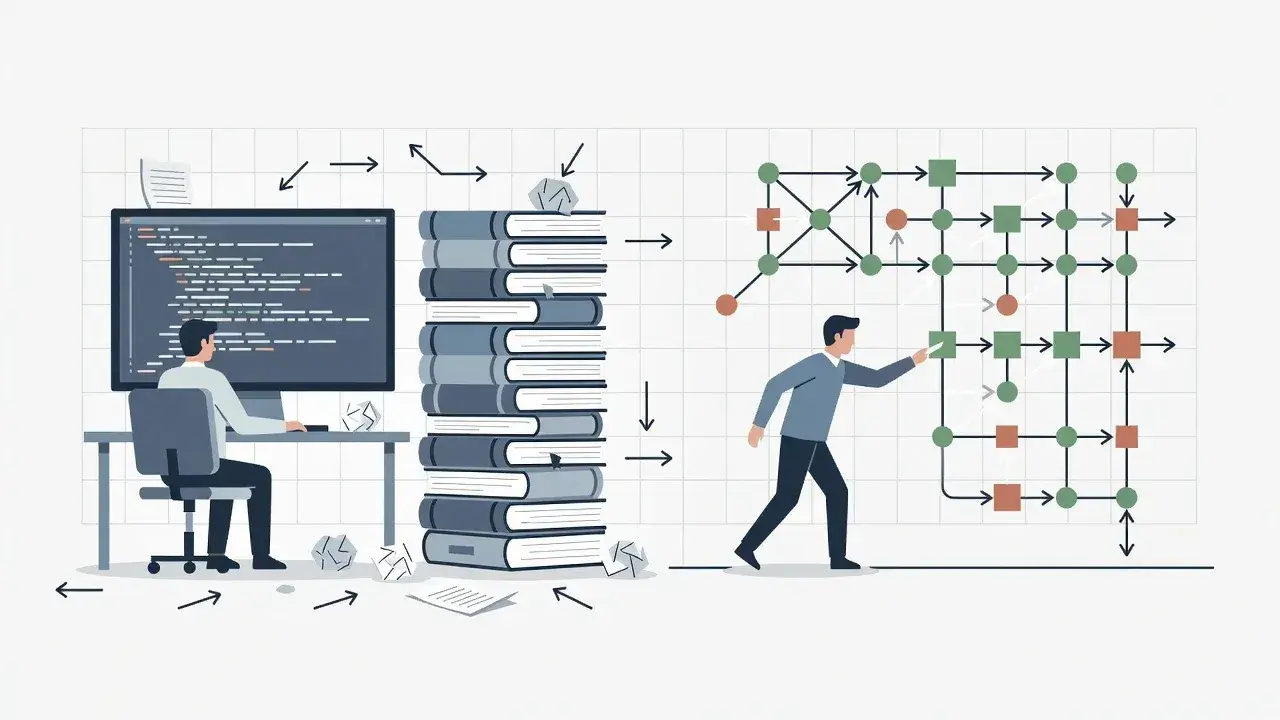
This traditional method can extend learning time unnecessarily because you're not developing the investigative skills that professional developers use daily. You're memorizing syntax instead of understanding behavior.
The core debugging technique explained
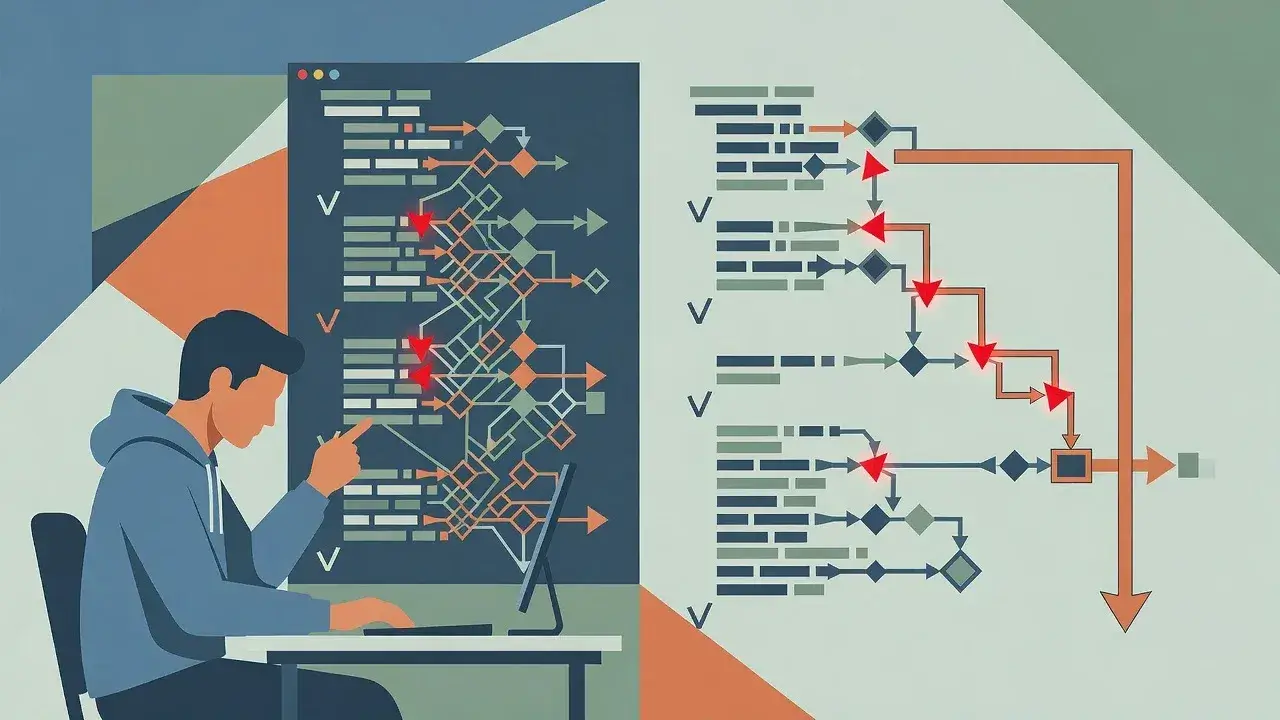
The technique centers on making your code's execution visible. Instead of running a program and only seeing the final output, you watch each step unfold.
Strategic print statement placement
Place System.out.println() statements at critical points in your code. Print variable values before and after operations, inside loops, and at method entry and exit points.
- Print variable states before conditional statements to understand which branch executes
- Display loop counter values to visualize iteration patterns
- Show method parameters and return values to track data flow
- Include descriptive labels like "Before calculation: x = " for clarity
This visibility transforms abstract code into a narrative you can follow. You see exactly how data changes, which conditions trigger, and where logic breaks down. The technique turns debugging from guessing into observation.
How breakpoints accelerate understanding
Modern IDEs like IntelliJ IDEA and Eclipse offer breakpoints that pause program execution at specific lines. This feature provides even deeper insight than print statements.
When execution stops at a breakpoint, you can inspect all variables in scope, evaluate expressions, and step through code line by line. This controlled environment lets you test hypotheses immediately.
Effective breakpoint strategies
- Set breakpoints where you think problems occur, not randomly throughout code
- Use conditional breakpoints that only trigger when specific conditions are met
- Step over methods you trust, step into methods you're learning
- Watch variables change in real-time as you step through execution
This approach builds mental models of how Java actually works. You stop memorizing and start understanding cause and effect in your programs.
Applying the technique to common Java concepts
This debugging approach proves especially valuable when learning challenging Java concepts that confuse beginners.
For loops become clear when you print the counter variable at each iteration. You see exactly how initialization, condition checking, and increment work together. Object-oriented concepts like inheritance make sense when you step through constructor calls and watch how parent class constructors execute before child class code.
Collections and arrays reveal their behavior when you print their contents before and after operations. You understand how add(), remove(), and get() methods actually manipulate data structures rather than just memorizing their syntax.
The learning acceleration effect
This technique cut my learning time in half because it eliminated the guessing phase that consumes so much beginner energy. Instead of wondering why code failed, I could see exactly where and why.
Each debugging session became a learning opportunity. Mistakes transformed from frustrations into insights. I developed intuition about how Java behaves because I'd observed that behavior directly hundreds of times.
The confidence this builds cannot be overstated. When you know you can diagnose any problem by making execution visible, you attempt more ambitious projects. This creates a positive feedback loop where increased confidence leads to more practice, which accelerates learning further.
Practical implementation for beginners
Start applying this technique today with a simple approach that requires no special tools beyond your IDE.
Your first debugging session
Take a program you've already written, even a simple one. Add print statements before and after every significant operation. Run it and read the output carefully.
- Compare what you expected to see with what actually printed
- Identify where expectations and reality diverged
- Add more detailed prints around that divergence point
- Repeat until you understand the exact cause
This systematic approach builds debugging skills that transfer to every future project. You're training yourself to think like a developer who solves problems methodically rather than randomly.
Conclusion
The debugging trick that cut my Java learning time in half isn't really a trick at all. It's a fundamental shift in how you interact with code, from passive reading to active investigation. By making program execution visible through strategic print statements and breakpoints, you transform learning from memorization into discovery. This approach builds genuine understanding that accelerates your progress and creates the problem-solving mindset professional developers rely on daily.