Java variables can leak memory through unintended object retention, autoboxing overhead, thread-local variables that aren't cleared, and static collections that accumulate references indefinitely, causing gradual performance degradation that often goes unnoticed until production systems experience OutOfMemoryError crashes.
Your Java variables are leaking memory and you probably don't know why because these leaks happen silently in the background. Most developers focus on obvious memory issues like large object allocations, but the real culprits are subtle patterns that accumulate over time. Understanding these hidden traps can save your application from unexpected failures and help you write more efficient code.
The hidden cost of autoboxing primitives
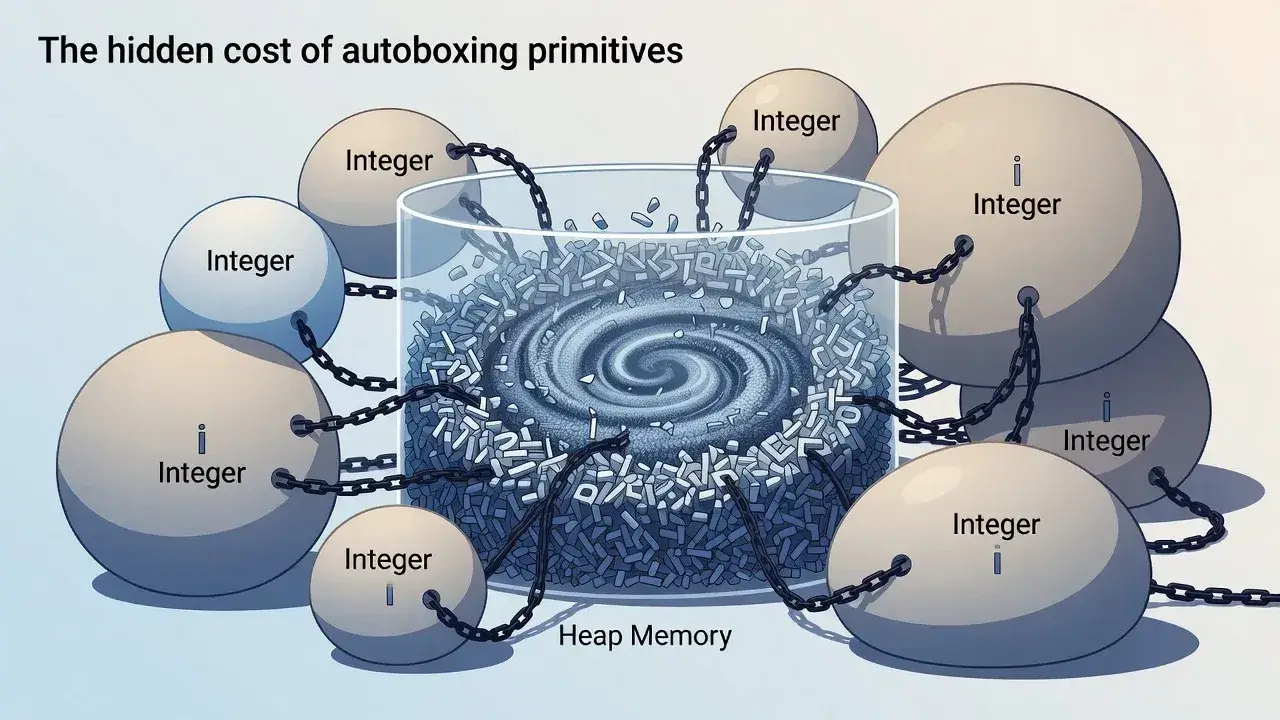
Autoboxing converts primitive types into their wrapper objects automatically, which seems convenient but creates unnecessary heap allocations. Every time you use an Integer instead of int in collections or method parameters, Java creates a new object that requires garbage collection.
When autoboxing becomes a memory problem
High-frequency operations like loops and stream processing can generate millions of temporary wrapper objects. Consider a simple loop that processes numeric data—each iteration might box and unbox values multiple times, creating memory pressure that impacts performance.
- Collections like ArrayList and HashMap only accept objects, forcing autoboxing
- Comparison operations between primitives and wrappers trigger implicit conversions
- Stream operations on numeric data create wrapper instances for each element
- Method overloading can unexpectedly choose wrapper versions over primitives
The solution involves using primitive-specialized collections from libraries like Trove or Eclipse Collections, and being conscious about when you actually need object wrappers versus raw primitives.
Thread-local variables that never get cleaned
ThreadLocal variables provide thread-safe storage but become memory leaks when threads outlive the objects they reference. Application servers and thread pools reuse threads, meaning ThreadLocal data persists across multiple requests unless explicitly removed.
Each thread maintains its own map of ThreadLocal variables. When you set a value, it stays attached to that thread until you call remove() or the thread terminates. In long-lived thread pools, this data accumulates indefinitely, holding references to objects that should have been garbage collected.
Identifying thread-local leaks
- Framework libraries often use ThreadLocal for request context without proper cleanup
- Custom security contexts stored per-thread can retain user session data
- Date formatters cached in ThreadLocal accumulate when not removed
- Database connections stored thread-locally prevent connection pool recycling
Always pair ThreadLocal.set() with try-finally blocks that call remove() to ensure cleanup happens regardless of exceptions or early returns.
Static collections that grow without bounds

Static fields live for the entire application lifetime, making them dangerous when they hold collections. A static HashMap used for caching can grow indefinitely, consuming memory that's never released until the JVM shuts down.
Many applications use static collections for registries, caches, or event listeners without implementing eviction policies. Each entry added to these collections creates a strong reference that prevents garbage collection, even when the referenced objects are no longer needed by the application logic.
Common static collection patterns that leak
Singleton patterns often maintain static collections of registered components or observers. Without proper lifecycle management, these registries accumulate entries from components that have been replaced or are no longer active.
- Event listener registries that don't remove unregistered listeners
- Cache implementations without size limits or time-based expiration
- Plugin registries that accumulate entries during hot deployments
Implementing weak references, size-bounded caches with LRU eviction, or explicit lifecycle callbacks helps prevent unbounded growth in static collections.
String concatenation in loops creates garbage
Using the plus operator for string concatenation inside loops generates intermediate String objects for each iteration. Since strings are immutable in Java, every concatenation creates a new object, leaving the old ones as garbage.
A loop that builds a large string by repeatedly concatenating can generate thousands of temporary objects. While modern JVMs optimize simple cases, complex loops still suffer from this pattern, especially when concatenating within nested loops or recursive methods.
Better approaches to string building
- StringBuilder provides mutable string buffers that avoid intermediate objects
- StringBuffer offers thread-safe alternatives when synchronization is needed
- String.join() and Collectors.joining() optimize common concatenation patterns
- Text blocks in modern Java reduce boilerplate for multi-line strings
Replacing string concatenation with StringBuilder in performance-critical code significantly reduces memory allocation and garbage collection overhead.
Inner classes holding outer references

Non-static inner classes automatically hold references to their enclosing instance, which can prevent garbage collection of the outer object. This hidden reference extends the lifetime of the outer class beyond its intended scope.
Anonymous inner classes and lambda expressions can capture references to their enclosing context, including the implicit this reference. When these inner classes are stored in long-lived collections or passed to frameworks, they keep the entire outer object alive in memory.
Avoiding unintended reference retention
Making inner classes static when they don't need access to outer instance members breaks the implicit reference chain. For lambdas and anonymous classes, being mindful of what variables you capture helps prevent accidental retention.
- Event handlers implemented as inner classes retain references to UI components
- Callback implementations passed to frameworks can leak activity contexts
- Comparator lambdas that capture large data structures for sorting
Using static nested classes, method references, or explicitly passing only required data to inner classes prevents these subtle memory leaks.
Resource streams left open without try-with-resources
File streams, database connections, and network sockets allocate native memory outside the Java heap. Failing to close these resources properly causes both heap and off-heap memory leaks that can destabilize applications.
The try-with-resources statement automatically closes resources that implement AutoCloseable, ensuring cleanup happens even when exceptions occur. Legacy code that manually calls close() in finally blocks often has bugs where exceptions prevent cleanup or multiple resources aren't all closed properly.
Resources that commonly leak
- BufferedReader and FileInputStream left open after reading files
- JDBC ResultSet and Statement objects not closed after queries
- HTTP client connections that don't get returned to connection pools
- Compression streams like GZIPInputStream without proper closure
Adopting try-with-resources consistently across your codebase eliminates an entire class of resource leaks and makes code more maintainable by reducing boilerplate error handling.
Vigilance prevents silent memory drain
Memory leaks in Java applications rarely announce themselves with immediate crashes. Instead, they accumulate gradually, degrading performance over hours or days until systems become unstable. By understanding these common patterns—autoboxing overhead, uncleaned ThreadLocal variables, unbounded static collections, inefficient string operations, inner class references, and unclosed resources—you can identify and eliminate leaks before they impact production. Regular heap dump analysis, profiling tools, and code reviews focused on these patterns help maintain application health and prevent the mysterious memory issues that plague many Java systems.