Java web applications often experience performance degradation not from code inefficiency or hardware limitations, but from subtle configuration oversights and runtime behaviors that accumulate over time, creating bottlenecks invisible to standard monitoring tools.
The hidden reason your Java web app feels slower than it should might not be what you think. While developers typically blame database queries or network latency, the real culprit often lurks in less obvious places. Many Java applications suffer from performance issues that remain undetected because teams focus on the wrong metrics. Understanding these hidden factors can transform your application's responsiveness and user experience.
The garbage collection trap nobody talks about
Most development teams overlook how garbage collection patterns affect perceived application speed. The JVM's memory management works silently in the background, but certain configurations create unpredictable pauses that users experience as sluggishness.
Understanding GC pause patterns
When your application handles moderate traffic, garbage collection might seem fine. The real problems emerge during peak usage when the heap fills faster than expected. Modern garbage collectors like G1GC or ZGC offer different trade-offs, but choosing the wrong one for your workload creates unnecessary delays.
- Long GC pauses during peak traffic hours indicate heap sizing issues
- Frequent minor collections suggest object creation patterns need optimization
- Full GC events exceeding 500ms create noticeable user experience degradation
- Memory leaks from unclosed resources gradually increase collection frequency
Garbage collection tuning requires understanding your application's actual memory behavior, not just applying generic recommendations. Monitoring GC logs reveals patterns that explain why your application feels slower during specific times or under particular load conditions.
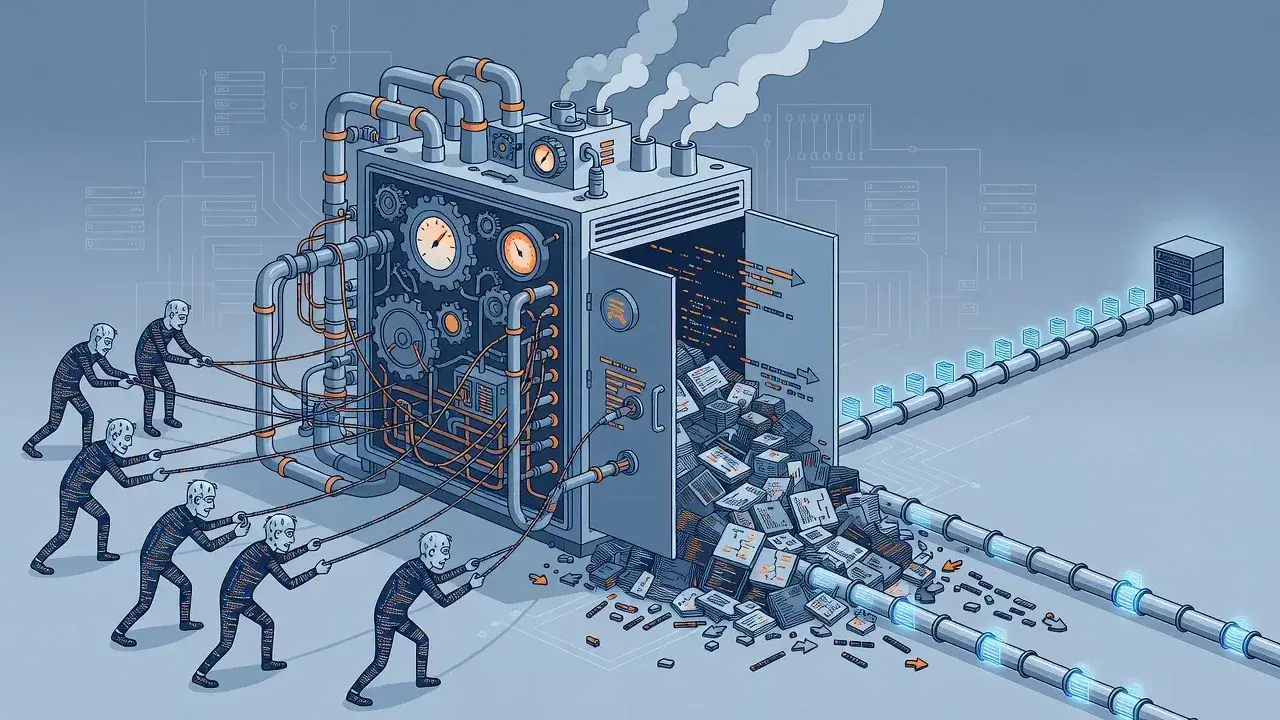
Thread pool starvation masquerading as slow responses
Application servers come with default thread pool configurations that rarely match production workloads. When all threads become occupied processing long-running requests, new requests queue indefinitely, creating the illusion of general slowness.
This problem compounds when blocking operations consume threads unnecessarily. A single slow database query can hold a thread hostage while dozens of fast requests wait their turn. The application appears slow globally even though only specific operations cause the bottleneck.
Identifying thread exhaustion
- Response times increase proportionally with concurrent users beyond a threshold
- Thread dumps show most threads in WAITING or TIMED_WAITING states
- CPU utilization remains low despite poor application performance
- Request queue depths grow during normal traffic patterns
Solving thread starvation requires analyzing which operations hold threads longest and whether asynchronous processing would improve throughput. Sometimes the solution involves increasing thread pools, but often it means redesigning how your application handles concurrent requests.
The connection pool bottleneck hiding in plain sight
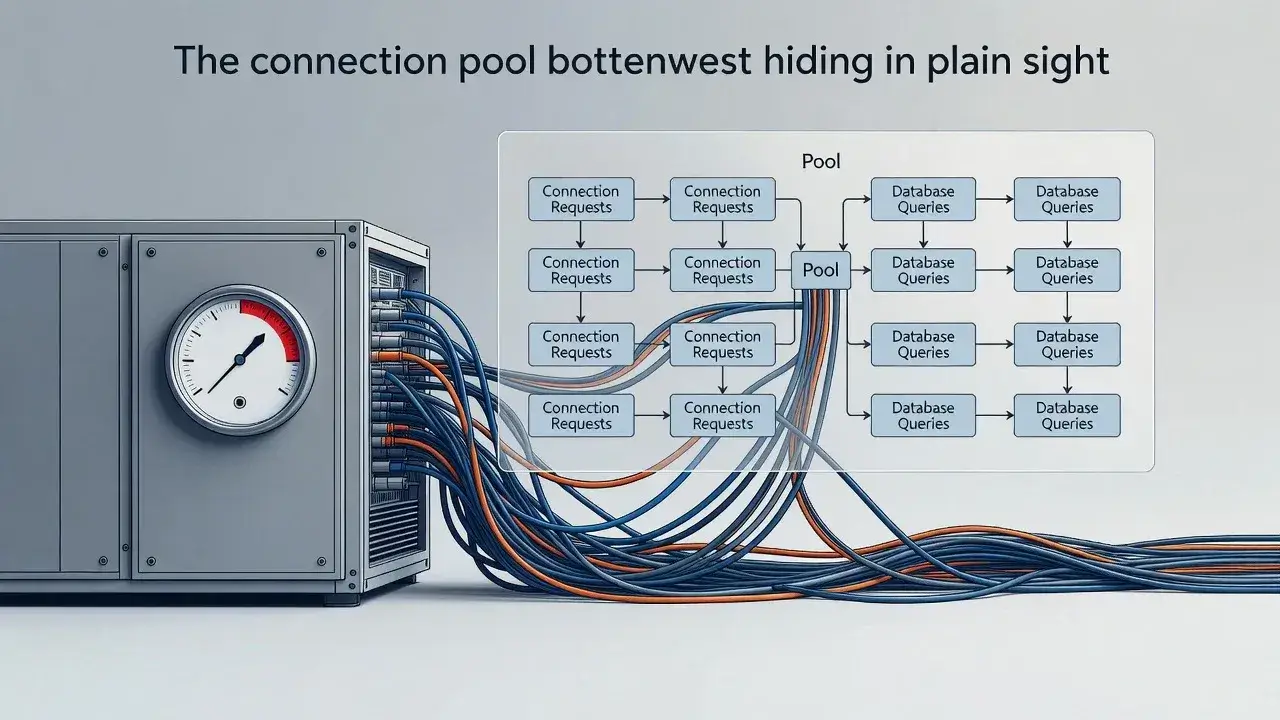
Database connection pools represent another common but overlooked performance killer. Applications often configure pools based on guesswork rather than actual connection usage patterns.
When connection pool size falls below the number of concurrent database operations, requests wait for available connections. This wait time adds directly to response times but often goes unnoticed because monitoring focuses on query execution time rather than connection acquisition time.
Connection leaks exacerbate this problem. A single code path that fails to close connections properly can gradually exhaust the pool, causing performance to degrade over hours or days until the application requires a restart.
Class loading delays that accumulate over time
Java's dynamic class loading mechanism introduces latency that becomes noticeable in certain scenarios. Applications using extensive reflection, dynamic proxies, or runtime code generation experience periodic slowdowns when the JVM loads new classes.
Common class loading scenarios
Frameworks like Spring and Hibernate generate proxy classes at runtime. The first request triggering a particular code path might take significantly longer than subsequent requests because the JVM must load and initialize classes. This creates inconsistent response times that users perceive as random slowness.
- First-time execution of lazy-loaded features shows 10-100x slower response times
- Applications with many conditional code paths experience unpredictable delays
- Microservices architectures amplify class loading overhead across service boundaries
Addressing class loading issues often involves strategic preloading of critical classes during application startup or redesigning code to minimize dynamic class generation during request processing.
Memory pressure from logging and monitoring
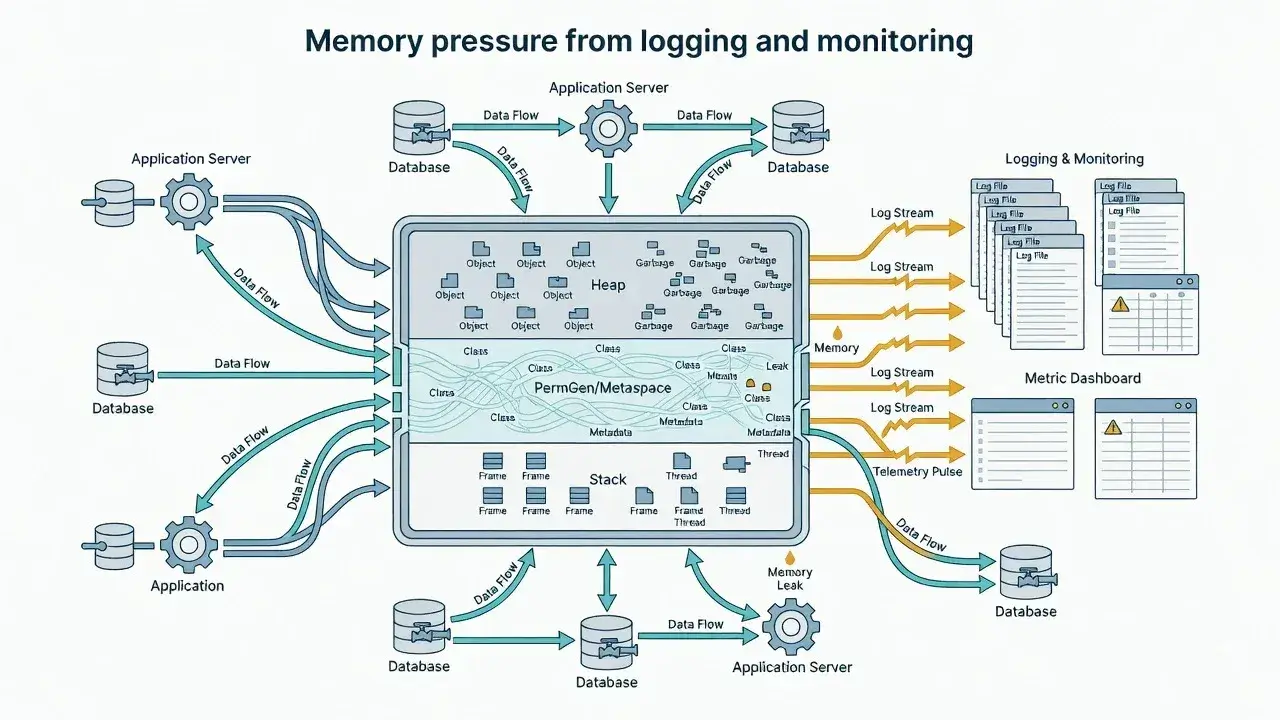
Observability tools meant to help diagnose performance problems sometimes become the problem themselves. Verbose logging configurations generate massive amounts of data that require processing, serialization, and transmission.
Each log statement creates objects that must be garbage collected. When logging runs synchronously, it adds latency directly to request processing. Even asynchronous logging consumes memory and CPU resources that could serve user requests.
Similarly, monitoring agents that collect detailed metrics can introduce overhead through bytecode instrumentation. The instrumentation adds small delays to every method call, which accumulates into noticeable slowness when multiplied across thousands of invocations per request.
Network timeout configurations causing cascading delays
Default network timeout values in HTTP clients and database drivers often prove too generous for modern applications. When a downstream service becomes slow or unresponsive, these long timeouts cause threads to block unnecessarily.
Timeout configuration impact
- Connection timeouts above 5 seconds waste resources on unreachable services
- Read timeouts exceeding expected response times mask downstream problems
- Missing timeouts allow indefinite blocking that exhausts thread pools
- Retry logic without exponential backoff amplifies problems during outages
Properly configured timeouts fail fast, allowing applications to return errors quickly or fall back to alternative strategies rather than making users wait for operations that will never succeed.
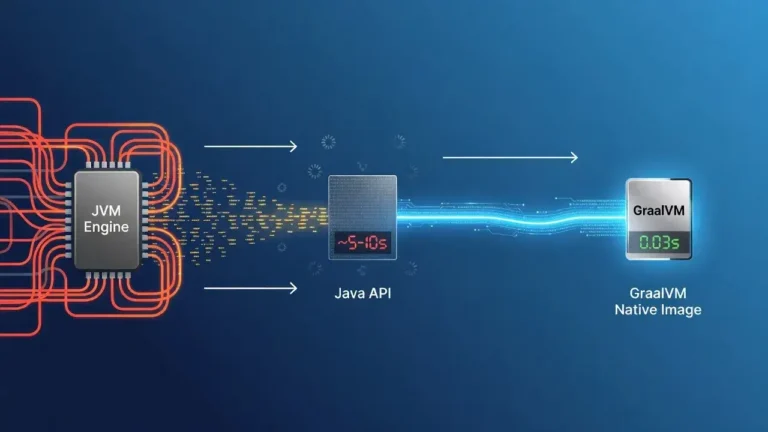
JIT compilation warm-up affecting perceived performance
The Java Virtual Machine optimizes code through Just-In-Time compilation, but this optimization happens gradually. Applications perform significantly slower immediately after startup until the JIT compiler identifies and optimizes hot code paths.
In containerized environments with frequent deployments or auto-scaling, applications never reach optimal performance before being replaced. Users consistently experience the slower interpreted or partially compiled code rather than the fully optimized version.
This warm-up period can last several minutes depending on application complexity and traffic patterns. The performance difference between a cold start and a fully warmed application can exceed 50%, making the application feel perpetually slow if instances don't run long enough to reach peak efficiency.
Diagnosing the invisible performance killers
The hidden reasons behind Java web application slowness rarely appear in standard performance metrics. Garbage collection pauses, thread pool exhaustion, connection bottlenecks, class loading delays, excessive observability overhead, misconfigured timeouts, and incomplete JIT optimization all contribute to poor user experience without obvious indicators. Identifying these issues requires looking beyond surface-level monitoring to understand how the JVM and your application interact under real-world conditions. Once you recognize these patterns, targeted optimizations can dramatically improve performance without major architectural changes.