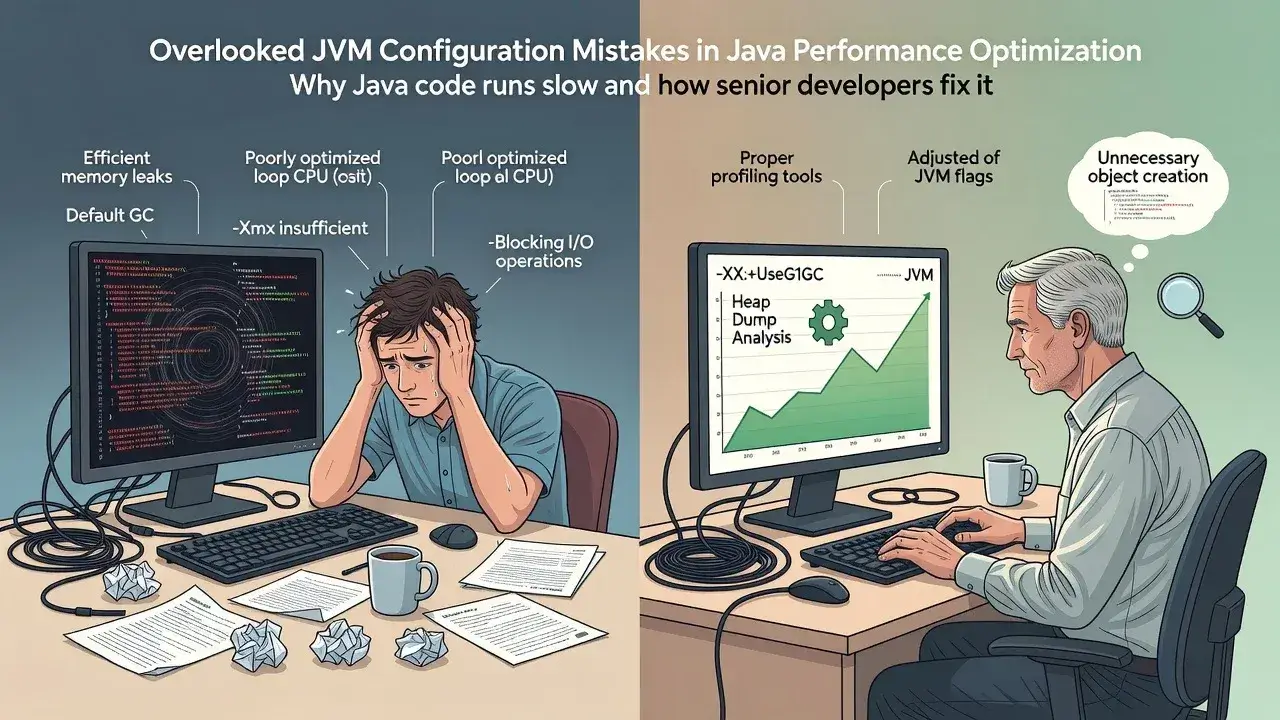
Java code often runs slow due to inefficient memory management, poorly optimized loops, unnecessary object creation, blocking I/O operations, and lack of proper profiling—senior developers fix these issues through systematic performance analysis, JVM tuning, algorithm optimization, and strategic use of concurrency patterns.
Why your Java code runs slow and how senior devs actually fix it isn't just about writing more lines or adding frameworks. Performance bottlenecks creep into applications through subtle mistakes that compound over time, and experienced developers know exactly where to look and what tools to use.
The hidden memory leaks draining your application

Memory leaks represent one of the most common yet overlooked causes of Java performance degradation. Even with garbage collection, applications can hold references longer than necessary, preventing memory reclamation.
Common memory leak patterns
Senior developers recognize that static collections, unclosed resources, and listener registrations create persistent references. These patterns accumulate objects in heap memory, eventually triggering frequent garbage collection cycles that pause application execution.
- Static collections that grow indefinitely without cleanup mechanisms
- Database connections and file streams left open after operations
- Event listeners registered but never removed from components
- ThreadLocal variables not cleared in long-running thread pools
Experienced developers use heap dump analysis tools like Eclipse MAT or VisualVM to identify retention paths. They examine which objects consume the most memory and trace back to the code creating unnecessary references, then implement proper resource management patterns.
Algorithm choices that kill performance silently
The difference between O(n) and O(n²) complexity becomes painfully obvious at scale. Many developers choose convenient data structures without considering their performance characteristics under real-world load.
Nested loops processing large collections create quadratic time complexity that seems fine during development but collapses in production. Senior developers profile code paths to identify hot spots, then replace inefficient algorithms with optimized alternatives. A simple switch from ArrayList to HashSet for membership testing can reduce execution time from minutes to milliseconds.
String concatenation inside loops presents another classic mistake. Each concatenation creates new String objects, overwhelming garbage collection. StringBuilder provides mutable string construction that prevents this overhead entirely.
JVM configuration mistakes developers overlook
Default JVM settings rarely match production workload requirements. Heap size, garbage collector selection, and thread stack allocation directly impact application throughput and latency.
Critical JVM parameters
- Heap size settings (-Xms and -Xmx) that match actual memory needs
- Garbage collector selection (G1GC for balanced performance, ZGC for low latency)
- Thread stack size (-Xss) optimization for applications with many threads
- Metaspace limits to prevent class loading memory issues
Experienced developers monitor GC logs to understand pause times and collection frequency. They adjust parameters based on actual application behavior rather than generic recommendations, testing changes under realistic load conditions before deployment.
Blocking operations that freeze your threads
Synchronous I/O operations lock threads while waiting for external resources. Database queries, file operations, and HTTP calls block execution, wasting valuable thread resources that could handle other requests.
Senior developers implement asynchronous patterns using CompletableFuture or reactive frameworks. These approaches free threads to process other work while waiting for I/O completion. Connection pooling prevents the overhead of establishing new database connections for each operation.
Proper timeout configuration prevents threads from waiting indefinitely when external services become unresponsive. Circuit breaker patterns protect applications from cascading failures when dependencies experience problems.
Object creation overhead nobody talks about

Creating objects carries computational cost—memory allocation, constructor execution, and eventual garbage collection. Applications that instantiate millions of short-lived objects create unnecessary pressure on the garbage collector.
Experienced developers use object pooling for expensive resources like database connections or large buffers. They apply the flyweight pattern to share immutable objects rather than creating duplicates. Primitive types replace wrapper classes where autoboxing isn't necessary, eliminating object allocation entirely.
Lazy initialization defers object creation until actually needed, reducing startup time and memory footprint. This pattern proves especially valuable for rarely-used components or expensive resources.
Concurrency problems that degrade under load
Thread contention emerges when multiple threads compete for shared resources. Excessive synchronization creates bottlenecks where threads wait instead of executing useful work.
Effective concurrency strategies
- Lock-free data structures like ConcurrentHashMap reduce contention
- Thread-local storage eliminates sharing for thread-specific data
- Atomic operations replace synchronized blocks for simple updates
- Read-write locks allow concurrent reads while protecting writes
Senior developers use profilers to identify lock contention and measure thread wait times. They refactor code to minimize shared state, applying immutability principles that eliminate synchronization needs entirely. Proper thread pool sizing prevents context switching overhead from excessive parallelism.
Profiling tools senior developers rely on
Guessing performance problems wastes time. Professional developers use profiling tools to measure actual behavior and identify real bottlenecks with data-driven precision.
JProfiler and YourKit provide comprehensive CPU and memory profiling with minimal overhead. Flight Recorder offers production-safe profiling built into modern JVMs. These tools reveal which methods consume the most CPU time, where memory allocates, and how threads spend their time.
Microbenchmarking with JMH validates optimization effectiveness by measuring performance changes accurately. This prevents premature optimization and confirms that changes actually improve performance rather than just appearing faster.
Performance requires systematic investigation
Java performance optimization demands methodical analysis rather than random code changes. Senior developers profile applications to identify actual bottlenecks, apply targeted fixes based on measurements, and validate improvements with concrete data. Understanding memory management, algorithm complexity, JVM configuration, and concurrency patterns separates developers who ship fast applications from those who constantly fight performance fires.