Java web applications frequently suffer from memory leaks caused by ThreadLocal variables that aren't properly cleared after request processing completes, leading to gradual memory exhaustion in application servers running multiple threads over extended periods.
Java web app memory leaks remain one of the most frustrating issues developers face in production environments. While most teams focus on obvious culprits like unclosed database connections or cached objects, there's a silent memory killer lurking in nearly every servlet-based application: improperly managed ThreadLocal variables that accumulate data across requests without ever releasing it.
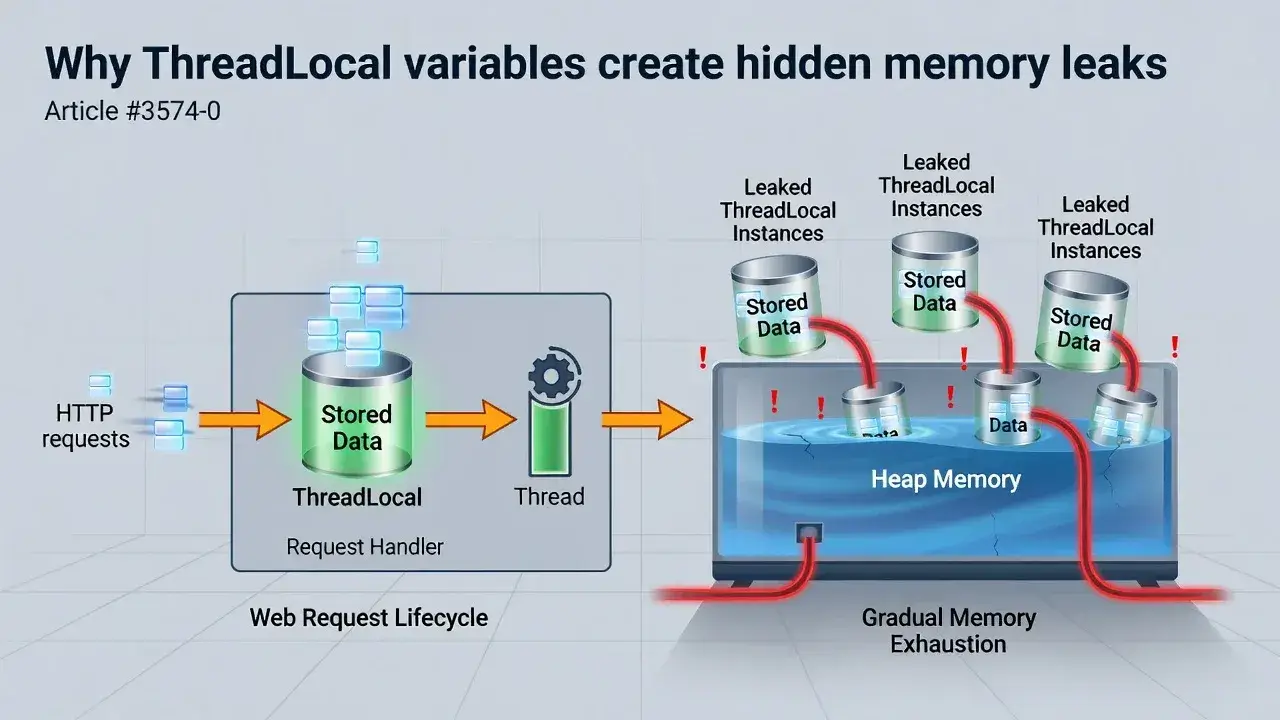
Why ThreadLocal variables create hidden memory leaks
ThreadLocal provides thread-confined variables that seem harmless at first glance. Each thread maintains its own isolated copy of the variable, making it perfect for storing request-specific data like user context or transaction information.
The problem emerges in web containers like Tomcat or Jetty that use thread pools. These servers recycle threads across multiple requests to optimize performance. When your code sets a ThreadLocal value during request processing but never clears it, that data remains attached to the thread even after the response is sent.
How thread pooling amplifies the issue
Application servers typically maintain a fixed pool of worker threads. A single thread might process thousands of requests during the application's lifetime. Each time your code stores data in a ThreadLocal without cleanup, you're essentially creating a permanent reference that prevents garbage collection.
- Thread pools reuse the same threads indefinitely
- ThreadLocal data persists between requests on recycled threads
- Multiple requests accumulate data without releasing memory
- Eventually, the heap fills with unreachable but referenced objects
This accumulation happens gradually, making it nearly impossible to detect during development or load testing. Production environments with sustained traffic patterns reveal the leak only after hours or days of operation.
Common scenarios where ThreadLocal leaks occur
Security frameworks represent the most frequent offenders. Many authentication libraries store user credentials or session tokens in ThreadLocal variables for convenient access throughout the request lifecycle.
Request context holders
Frameworks like Spring use ThreadLocal extensively to maintain request contexts. If you create custom context holders following similar patterns without proper cleanup, you're introducing potential leaks.
- Database transaction managers storing connection state
- Logging frameworks maintaining request IDs for correlation
- Custom audit trails tracking user actions per request
The danger multiplies when these contexts hold references to large objects or collections. A seemingly innocent user object might reference a session, which references cached data structures, creating a chain of retained memory.
Detecting ThreadLocal leaks in running applications

Memory profilers like VisualVM or YourKit can identify ThreadLocal leaks, but you need to know what you're looking for. Standard heap dumps show threads retaining unexpected amounts of memory.
Look for threads in the worker pool holding references to application-specific classes that should have been garbage collected. Thread names typically include patterns like "http-nio-8080-exec" in Tomcat or "qtp" in Jetty.
Analyzing heap dumps effectively
When examining heap dumps, focus on ThreadLocalMap entries. Each Thread object contains a threadLocals field pointing to a ThreadLocalMap. Inspect the map's entries to see what your application stored and never removed.
- Filter heap dump by Thread class instances
- Examine threadLocals field for each worker thread
- Identify application classes referenced in the map
- Trace back to the code that created those ThreadLocal instances
Modern profilers provide retention path analysis, showing exactly which objects prevent garbage collection. This feature proves invaluable for understanding the complete reference chain from thread to leaked object.
Implementing proper ThreadLocal cleanup patterns
The solution requires disciplined cleanup after every request. Servlet filters provide the ideal interception point for managing ThreadLocal lifecycle across your entire application.
Create a filter that executes after all other processing completes. In the finally block, explicitly call remove() on every ThreadLocal variable your application uses. This pattern ensures cleanup happens regardless of exceptions or early returns.
Using try-finally blocks consistently
Every code path that sets a ThreadLocal value must have a corresponding cleanup. The try-finally pattern guarantees execution even when exceptions occur during request processing.
- Initialize ThreadLocal in the try block
- Process request with access to thread-local data
- Always call ThreadLocal.remove() in finally
Framework-provided ThreadLocal utilities often include automatic cleanup mechanisms. Spring's RequestContextHolder, for example, clears data after request completion when properly configured. However, custom ThreadLocal variables require manual management.
Prevention strategies for development teams
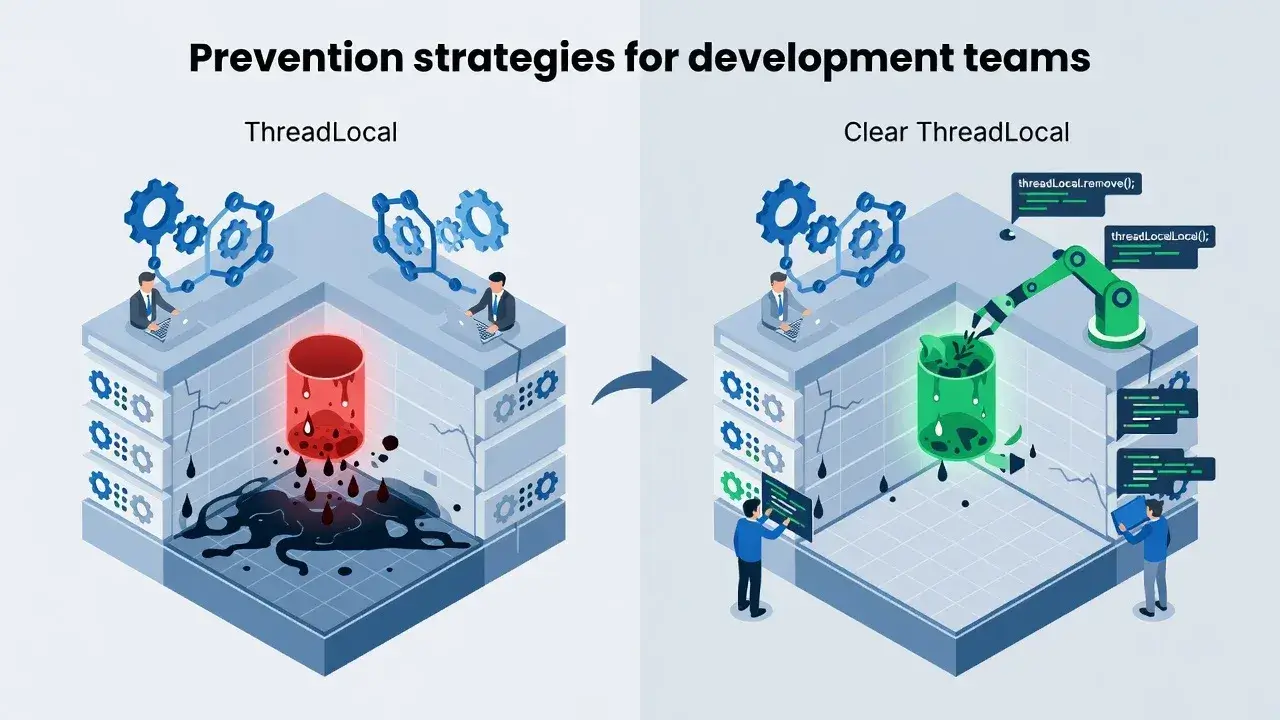
Code review processes should flag any new ThreadLocal declarations. Establish team guidelines requiring explicit cleanup code for every ThreadLocal usage, with no exceptions.
Static analysis tools can detect ThreadLocal declarations without corresponding remove() calls. Configure your build pipeline to fail when it finds potential leaks, forcing developers to address cleanup before merging code.
Alternative approaches to ThreadLocal
Consider whether you actually need ThreadLocal. Request-scoped objects managed by dependency injection frameworks provide similar benefits without manual cleanup responsibilities.
- Use framework-provided request scopes instead of ThreadLocal
- Pass context objects explicitly through method parameters
- Leverage servlet request attributes for request-specific data
- Implement automatic cleanup through framework lifecycle hooks
Modern frameworks handle cleanup automatically when you use their built-in scoping mechanisms. Custom ThreadLocal usage should be reserved for specific performance-critical scenarios where the benefits clearly outweigh the maintenance burden.
Monitoring production applications for memory issues
Implement memory usage alerts that trigger before OutOfMemoryError crashes your application. Monitor heap utilization trends over time, watching for gradual increases that suggest leaks rather than normal usage patterns.
Application performance monitoring tools like New Relic or Datadog track memory metrics continuously. Configure alerts when memory usage exceeds thresholds or grows steadily without corresponding traffic increases.
Regular heap dump analysis during production operation helps catch leaks early. Schedule automated dumps during low-traffic periods and analyze them for unexpected memory retention patterns. This proactive approach identifies problems before they impact users.
Protecting your application from ThreadLocal leaks
ThreadLocal memory leaks represent a persistent challenge in Java web development, but they're entirely preventable through disciplined coding practices and proper cleanup patterns. By understanding how thread pooling interacts with ThreadLocal storage, implementing consistent cleanup routines, and monitoring production applications for memory anomalies, you can eliminate this common source of application instability. The key lies in treating ThreadLocal variables as resources requiring explicit lifecycle management, just like database connections or file handles.